نشرت على Dec 28, 2019
Call Center KPIs : Definitions & Best Practices
All about Call Center KPI, case studies, definitions and industry standards to improve your customer support performance by monitoring KPI
Customer Experience Call Center KPIs and Metrics
Call Center KPIs are essential for any business, they are real indicators of how the business is going so they can evaluate the overall performance of the call center.
| Category | KPI | Description | Industry Standard | Formula | How to ensure KPI is met |
|---|---|---|---|---|---|
| Customer Experience | Service Level (SL) | SL is defined by how many calls are being answered within a set time usually called SL Threshold time | 80% of calls answered within 20 secs (Some call centers aim for 90% within 15 secs) | SL % = (Total no of answered calls within the SL threshold time)/ (Total no of received calls) X 100% | Proper long-term staffing plan taking into consideration on/off peak times. |
Service Levels Across Channels
| Channels | Industry Standard | Comments |
|---|---|---|
| 95% of emails answered within four hours | Better call centers are aiming to respond to 80% of emails within 15 minutes | |
| Live Chat | 80% of chats answered within 40 seconds | |
| Social Media | 80% of contacts answered within 20 minutes | |
| SMS/Messaging Apps | 80% of messages responded to within 40 seconds |
CASE STUDY
How to increase customer satisfaction by enhancing the SL?
| The Company | Xpress Telecommunication |
| Challenges |
|
| Solution |
|
| Results |
|
| Category | KPI | Description | Industry Standard | Formula | How to ensure KPI is met |
|---|---|---|---|---|---|
| Customer Experience | Quality Assurance (QA) | Testing the functionalities of the tool and use cases on a random weekly or monthly sample that covers different shifts, queues and agent skills. | Quality score should fall between 75 and 90% | Right quality assurance tool in addition to having a dedicated QA team (Luckily with ZIWO, we have this tool ready for you) | |
| Customer Experience | First Contact Resolution (FCR) | A contact center’s ability to resolve customer problems, questions or needs the first time they call, with no follow-up required. |
70–75% | FCR % = (Total number of incidents resolved on first contact)/ (Total number of received incidents) X 100% (Incidents can be calls, emails, chats, messages, etc.) | Effective and smart ACD plans where calls are routed to the correct queues and agents are assigned as per their correct skillsets. Continuous training for your agents. For Omnichannel contact centers better to measure it per channel |
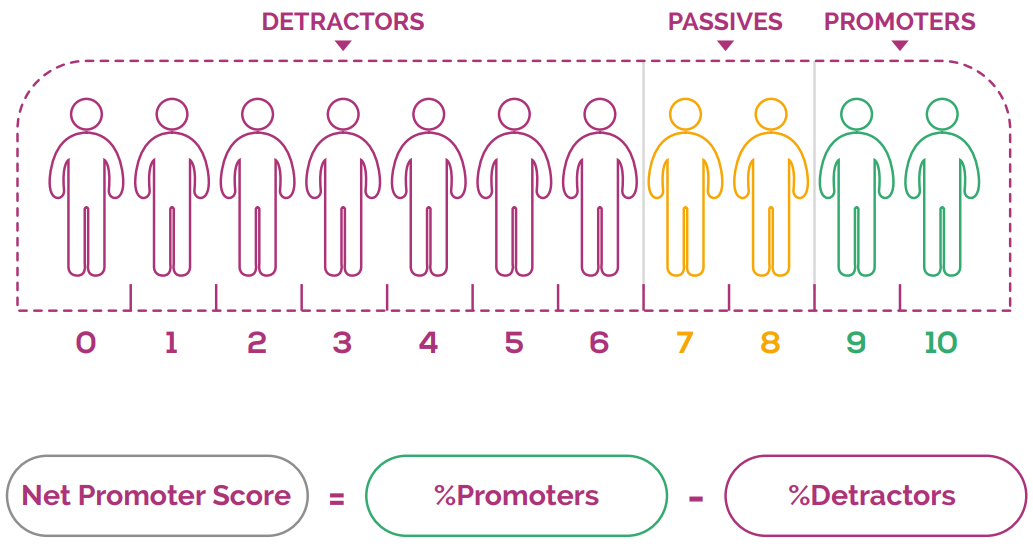
| Customer Experience | Net Promoter Score (NPS) | This metric is simple but very powerful tool to measure your customers’ satisfaction and their loyalty by asking one ultimate question | We are all hoping to exceed 10! | 1-Promoters = respondents giving a 9 or 10 score 2-Passives = respondents giving a 7 or 8 score 3-Detractors = respondents giving a 0 to 6 score |
-Focus on knowing your Detractors, this is where our pain points are laying. -Make sure you are having a seamless customer journey map. -Loyalty programs. -Appreciate your promoters and tailor special discounts/ gifts/ offers for them. |
NPS Example:
“How likely are you to recommend company/brand/product X to a friend/colleague/relative?”
This can be answered on an 11-point rating scale, ranging from 0 (not at all likely) to 10 (extremely likely).
Call Initiation Metrics and KPIs
| Category | KPI | Description | Industry Standard | Formula | How to ensure KPI is met |
|---|---|---|---|---|---|
| Call Initiation | Blocking Rate | Percentage of Call Blocked | It should be kept as low as possible (below 1%) | SL % = (Total no of answered calls within the SL threshold time)/ (Total no of received calls) X 100% | Proper long-term staffing plan taking into consideration on/off peak times. |
| Call Initiation | Abandoned Rate | This Call Call Center KPI is a measure for calls that were abandoned in the IVR + queue | Acceptable rate falls between 2%- 5%. Above 5% is considered problematic. | ((No of Calls Offered- No of Calls Handled)/(No of Calls Offered )) x 100 | -Proper workforce planning (roaster) (have enough agents covering peak hours). -Better forecasting and scheduling for call peaks. -Using call back technology. -Improving In-Queue messages and avoid long IVR options (Trees). |
Percentage of Call Blocked (Blocking Rate)
This Call Center KPI has a large impact on customer satisfaction. It is defined as the percentage of inbound callers that received the busy tone when they call and is often caused by one of the following
Agent Productivity Call Center KPIs & Metrics
| Category | KPI | Description | Industry Standard | Formula | How to ensure KPI is met |
|---|---|---|---|---|---|
| Agent Productivity | Average Handling Time (AHT) | This KPI is a key measure as it tells you how long a new call takes to be handled and not just the talk time. | This will vary greatly depending on the industry and the scale of business. | = Total Talk Time+Total HoldTime + TotalWrap Time | -Creating call center scripts and canned responses for FAQs -Unifying all tools used by the agent into 1 screen -Recording all calls for agent’s training session (Hint: Always look for very short and very long call durations). Root Cause ANalysis for repeated/high on hold calls |
| Wrap Up Time or After Call Work (ACW) | Wrap time is also known After call work (ACW) & measures the average time it takes agents to do the work associated with a call after it’s finished. | It is recommended to be between 10 and 15 seconds. | Average ACW = Time to complete ACW for all call / Total number of answered calls | You need your agents to spend enough time to do this work accurately. However, if ACW time is too high, there may be something else going on. The value of wrap up time can be entered in your call center platform based on your historical calculation of the average ACW and its impact on SL. | |
| Average Speed of Answer (ASA) | With this critical metric, call centers can assess how long it takes for agents to answer a waiting call. When this metric is too high, it can mean that agents are taking too long on calls or taking too much time to pick up new calls. | The faster an agent can answer the call the better. Recommended ASA is 3 to 4 rings. | (Total waiting time for answered calls / Total number of answered calls)/- No of calls handled | ||
| Occupancy | Occupancy is calculated as a percentage and represents the amount of time that advisors spend on call-related activity while they are logged in and expected to be taking calls. Call-related activity includes talk time, hold time and wrap up time. It is often referred to as “productive time”. | (Total Contact Handling Time/ Total Logged Time) x 100 | |||
| Utilization | utilization represents the amount of time that advisors spend logged-in, handling and expecting contacts, while being present in the call center. | (Total Logged in Time/Total Shift Time) x100 |
1. Average Handling Time (AHT)
The goal of many call centers is to reduce AHT, to maximize efficiency and to increase the SL. However, this can have a negative impact on service quality.
2. Wrap Up Time or After Call Work (ACW)
Wrap up time or Average After Call Work Time is a great way to measure call center agent productivity. Average after call work time measures the average time it takes agents to do the work associated with a call after it’s finished.
You need your agents to spend enough time to do this work accurately and thoroughly. However, if you find that the average After Call Work time is too high, there may be something else going on.
The value of wrap up time or the ACW can be entered in your call center platform based on your historical calculation of the average ACW and its impact on SL.
3. Average Speed of Answer (ASA)
With this critical metric, call centers can assess how long it takes for agents to answer a waiting call. When this metric is too high, it can mean that agents are taking too long on calls or taking too much time to pick up new calls.
CASE STUDY
How to improve the SL by implementing the ASA KPI?
| The Company | MarkaVIP |
| Challenges |
|
| Solution |
|
| Results |
|
10- Occupancy and Utilization
Many professionals are mistakenly thinking that occupancy and utilization are the same while they are completely different metrics.
What is Occupancy?
It is typical for a contact center’s occupancy to lie between 80 and 85%, and if your occupancy rate is at this level, it is likely that your Resource Planning team is doing a good job. However, if occupancy is consistently higher than 85%, you are at risk of agent burnout.
What is Utilization?
Like occupancy, utilization is calculated as a percentage. However, it differs from occupancy as utilization instead represents the amount of time that advisors spend logged-in, handling, and expecting contacts while being present in the call center.
TOP 9 WAYS TO MAKE THE BEST OF YOUR METRICS/KPIs?
1. Always ask yourself: “What do I want to achieve behind this KPI?”
2. Always ask yourself: “Why do I need this information or report?”
3. Keep re-visiting and engineering your KPIs, it is an ongoing evaluation process
4. Don’t stick to your historical KPIs because this is what we have always done.
5. Ask your agents: “What is stopping you from achieving your targets?”
6. Think about which metric is suitable for your industry.
7. Empower your agents and motivate them to do more and go the extra mile.
8. Produce findings and reports that anyone can understand.
9. Keep it as simple as possible.
قراءات
أحدث الأخبار
مقابلات، نصائح، دليل، أفضل الممارسات في الصناعة، وأخبار
Strategies for a Productive First Contact with Clients
Take time to focus on the First Contact with Clients, so you can adjust the customer experience (CX) strategy to provide the best service.
اقرا المزيد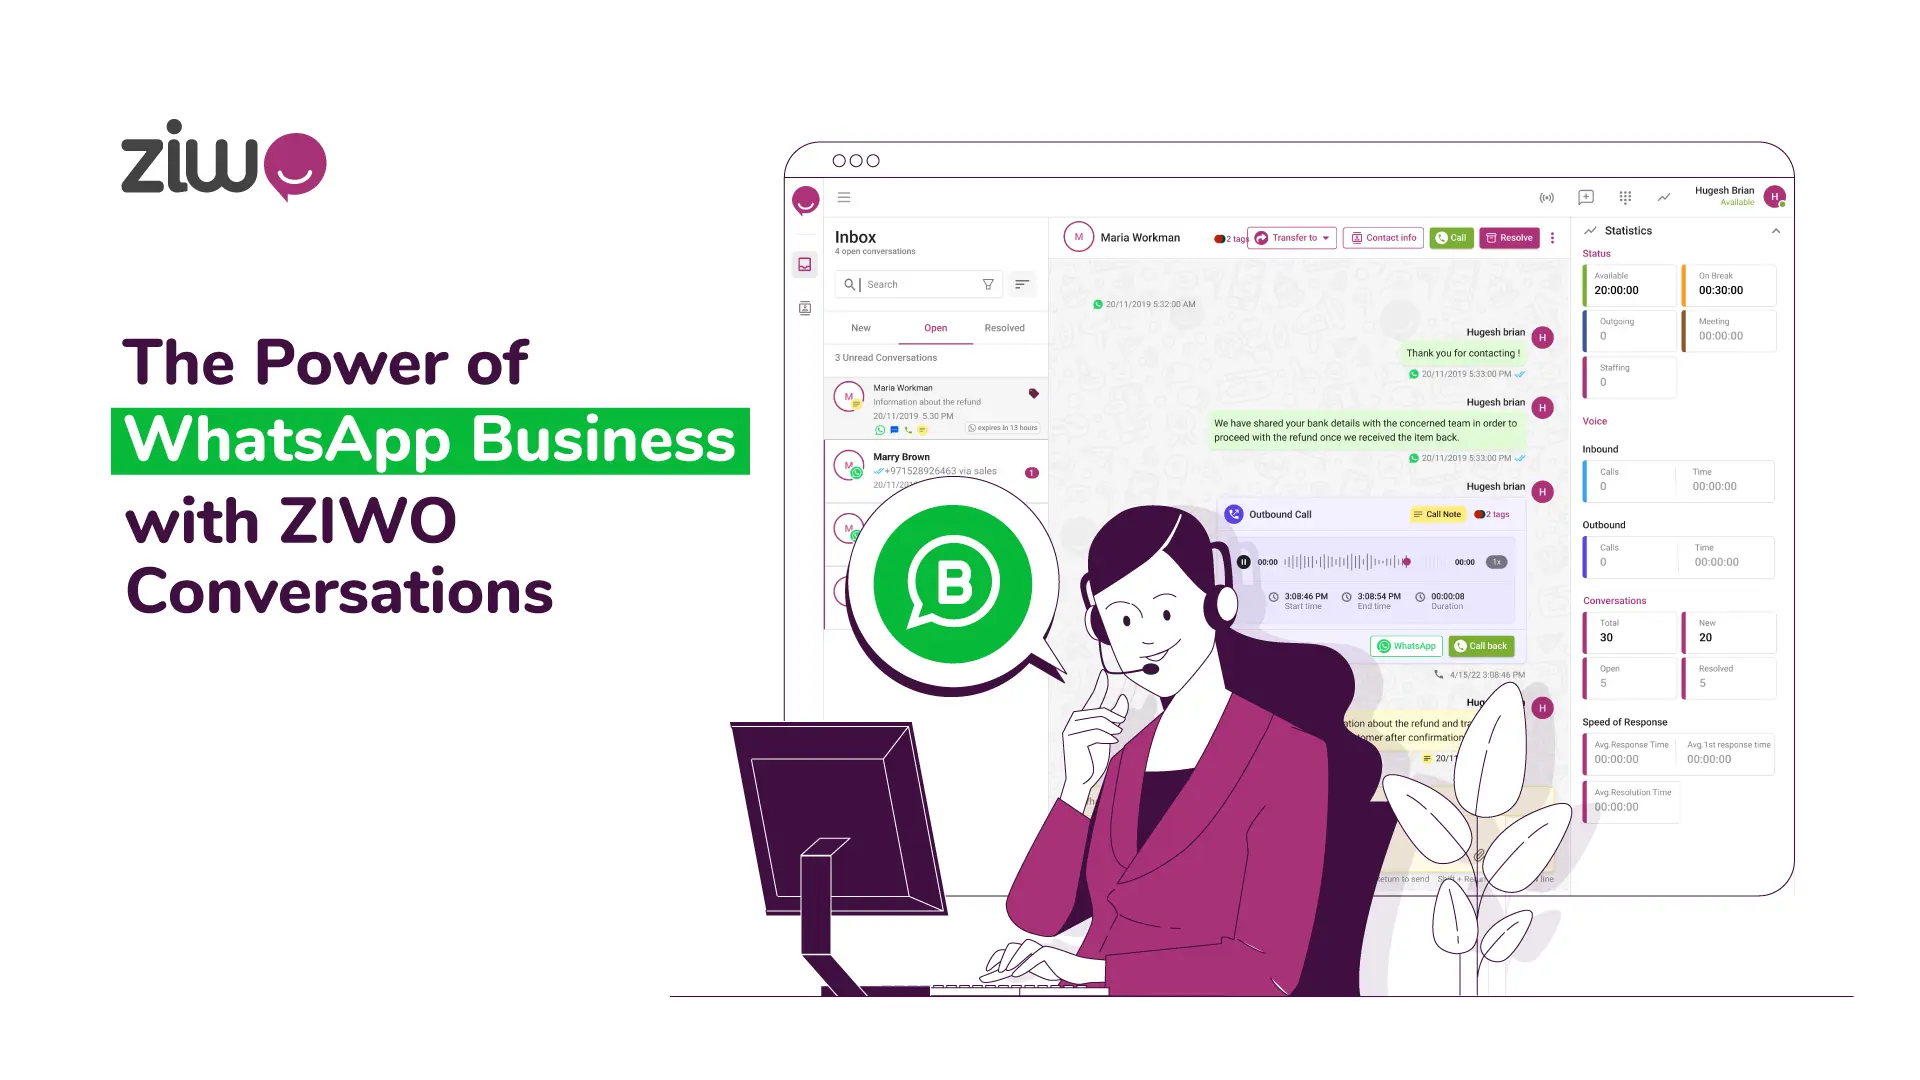
The Power of WhatsApp Business with ZIWO Conversations
ZIWO Conversations is recognized as the premier WhatsApp Business Companion, elevating both customer experiences and team collaboration to a higher standard.
اقرا المزيد
Pause and Resume Call Recording – Benefits & Industries
agents can manually pause and resume call recordings, Once an administrator has enabled the feature, agents will see a button on the dialpad
اقرا المزيد
Outbound IVR (Interactive Voice Response) – Definition, Components, Benefits & Practices
Outbound IVR feature is a contact center tool that is used to proactively distribute communications to customers with a predefined IVR menu.
اقرا المزيد
How to Become a Customer-Centric Organization
Ways to Build a customer-centric culture in your company, customer-centricity needs to be part of your philosophy, values, and mission daily.
اقرا المزيد
Multilingual Contact Centers: Bridging Language Gaps
Discover how multilingual contact centers overcome language barriers to deliver outstanding assistance, thereby elevating customer experience
اقرا المزيد